Electrical Grid Frequency Meter
2022
SchematicInner Board Layout
Outer Board Layout
STM32CubeIDE Project
The instantaneous frequency of the electrical grid is rarely exactly 60 Hz. For example, when I last updated this page, it was 60.01413 Hz in Seattle. Its long term average is 60 Hz, but at any moment it is likely somewhere in the range of 59.95-60.05 Hz. I could not find any live frequency data online for the Western Interconnect, so I decided to collect my own. FNET/GridEye has coarse data, but it does not display any numeric frequency measurements. For this project, I mostly just thought it would be neat to build an analog grid frequency meter that I could glance at — logging the data for later graphing and analysis was an afterthought.
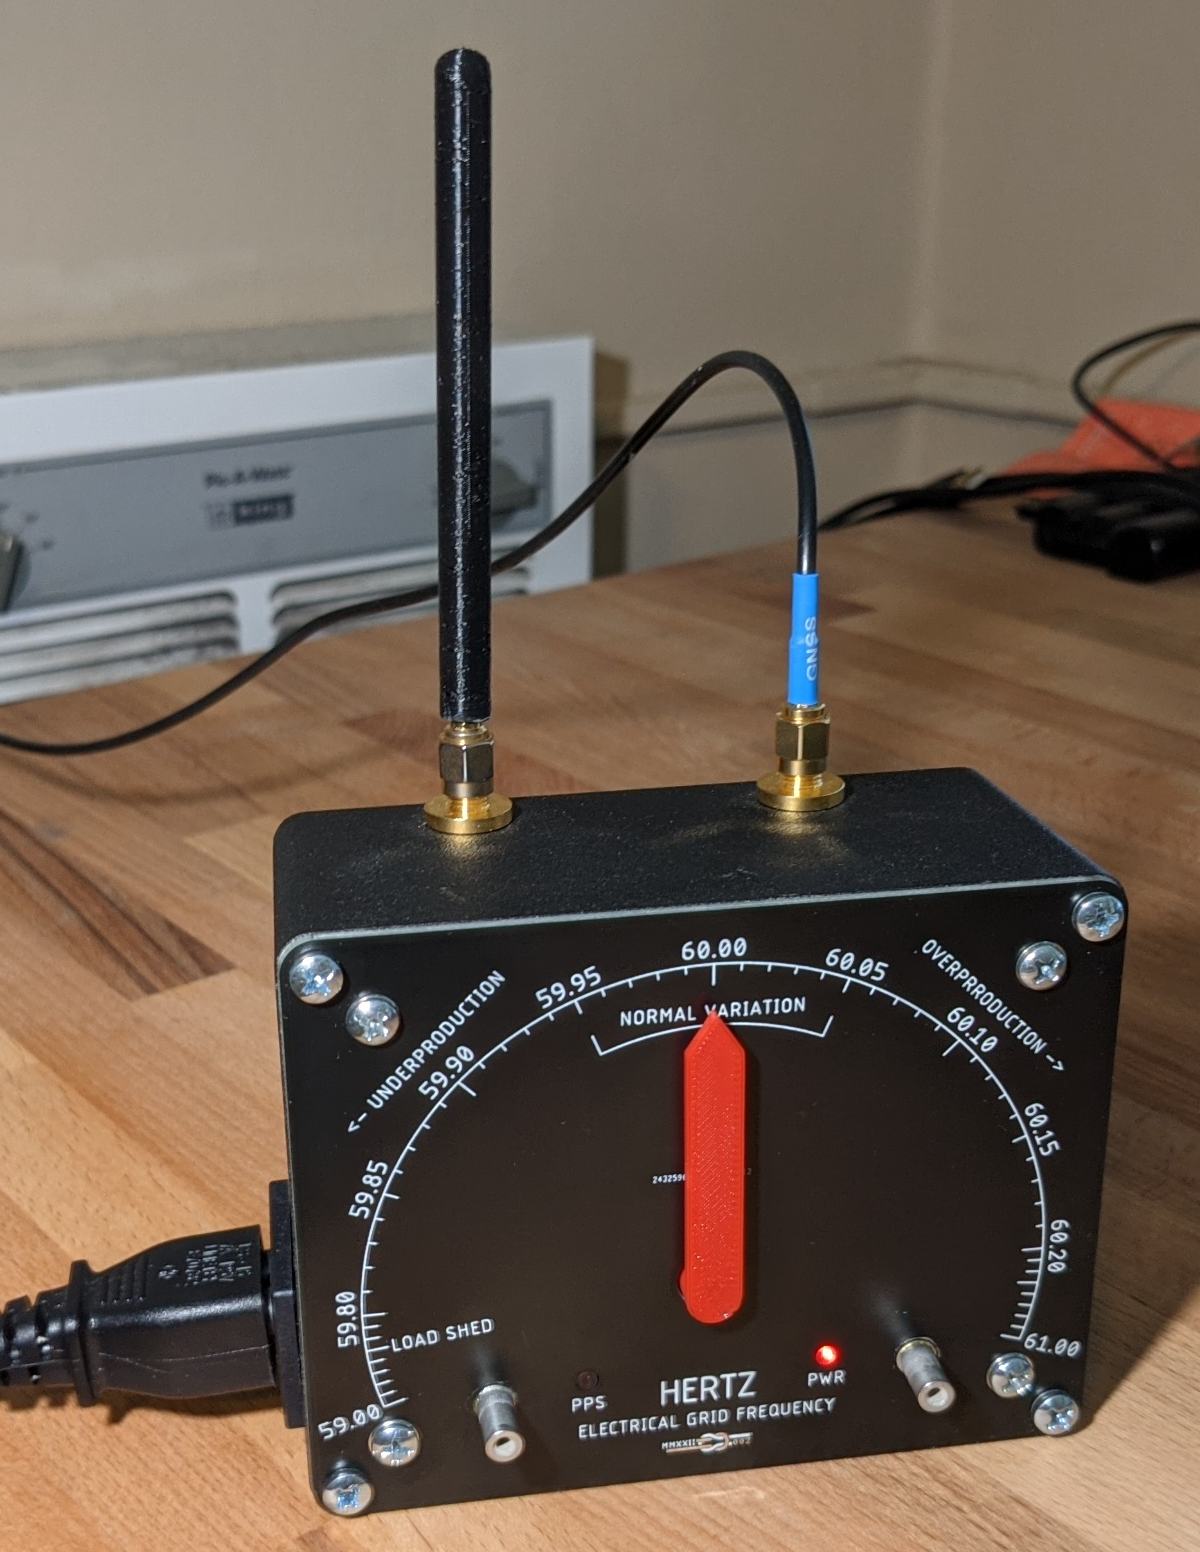
Assembled Meter with Added WiFi Antenna for Logging Through ESP32
Adding an ESP32 to this box and setting up the server-side stuff to support logging and graphing data is covered on this page.
Background
The electrical grid in the United States is nominally 60 Hz. This frequency is maintained by carefully balancing generation to match demand. When demand increases, frequency begins to drop (the system has physical inertia from all the spinning generators, so it takes time to 'spin-down') and generation must be increased to bring frequency back up to 60Hz. The normal range of frequency variation is around 59.95-60.05 Hz. There are occasional excursions beyond this range, but nothing will be noticed by the public until frequency drops low enough that grid operators cut supply to some customers (load shed).
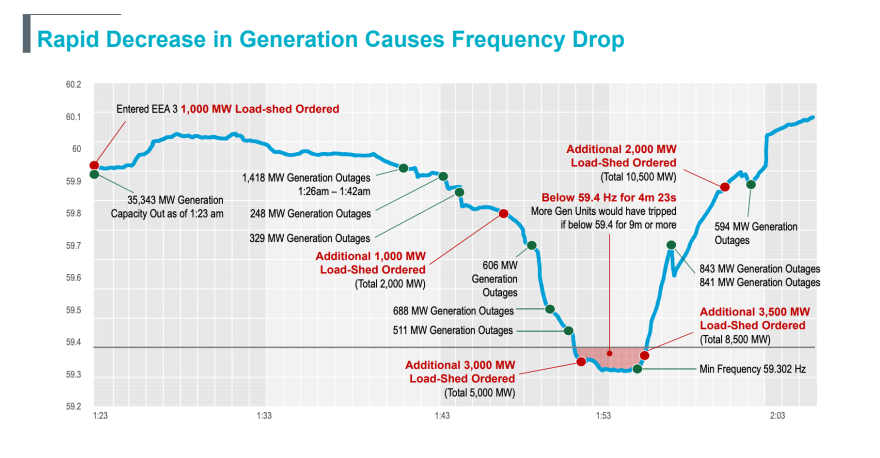
Texas Interconnection Frequency Deviation at Beginning of 2021 Blackout
For example, in the 2021 Texas blackout, grid operators ordered load shed five times before getting frequency back within a safe range. The three US electrical interconnections (East, West, and Texas) each have their own standards for how to respond to under-frequency events. The Eastern and Western Interconnection allow frequency deviation down to 59.5 Hz without load shed, but the smaller Texas Interconnection allows deviations down to 59.3 Hz.
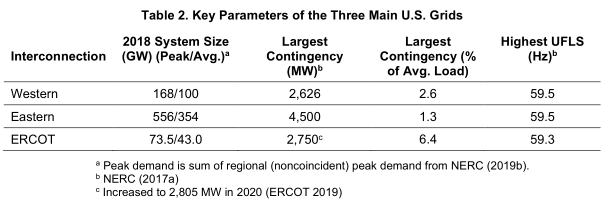
Under-Frequency Load Shed (UFLS) Set points from Inertia and the Power Grid: A Guide Without the Spin
The specific load shed plan for the Western Interconnection is shown below.
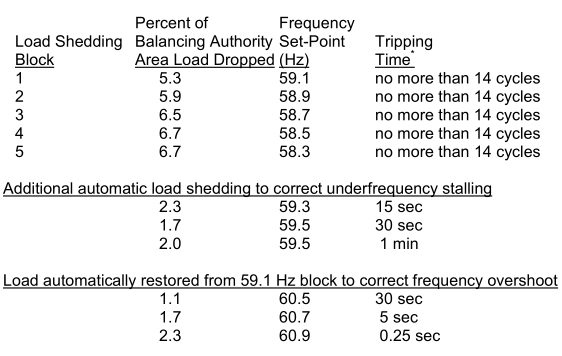
UFLS Plan for the Western Interconnect Source
The time to trip and area tripped is set up so that the system can rapidly respond to major events which risk immediate damage and respond more slowly to less severe events. It is actually steam and gas turbine generators that are most sensitive to frequency variation. Turbine blades are designed to avoid resonance at the operating frequency, but it is not as simple as making sure that the fundamental frequency of the blade doesn't line up with the angular frequency of the turbine — you have to avoid both the harmonics of the stimulus (angular frequency) and the modes of vibration. Here's an example of blade stress vs. frequency for a 50 Hz turbine:
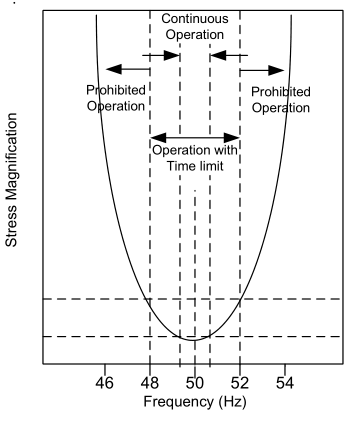
Source: A Study on Turbine Blade Fatigue Protection
When the grid operates at sufficiently off-nominal frequencies, operators aren't just risking damage, they are actively incurring damage. The Western Interconnect Load Shedding Plan states "This Coordinated Plan should conform to the 5% loss of life of turbine blades recommendations as determined by generator manufacturers." This implies that the trip points were selected to limit turbine damage to an acceptable level, not to prevent it entirely.
Frequency Measurement
Phase Measurement Units are used by utilities to measure the instantaneous frequency and phase of the grid. Instantaneous phase and frequency will vary from location to location depending on which areas are net generators and which areas are net consumers. Because instantaneous frequency is defined as change in phase over change in time, a location that switches from being a producer to a consumer will have a lower frequency during that transition. The average frequency, though, is still the same across the grid, and from looking at what coarse data is available on the public site of FNET/GridEye, frequency deviation measurements taken across the Western Interconnect are normally within 0.01Hz of each other. To make sure that measurements are synchronized across wide geographic areas, Phase Measurement Units use GPS as a time reference. The output of a synchronized phase measurement unit is known as a synchrophaser (an impressively science-y word).
Phase Measurement Units measure frequency and phase by sampling a scaled down version of the AC waveform with an ADC. This allows for higher measurement rate than just looking at zero-crossings since change in phase can be measured continuously by comparing the sampled signal to a reference signal. Phasor Estimation and Modelling Techniques of PMU- A Review describes commonly used techniques for this. I don't need sub-cycle accuracy for frequency and phase measurement, though, so I just measure time between crossings of a scaled down version of the AC input. At least one commercial frequency measurement product also uses only zero crossings.
My Circuit
There are two commonly used ways to scale down line voltage for measurement by a low voltage device: transformer isolation and direct coupling. With transformer isolation, you step the voltage down by the turns ratio of the transformer. With direct coupling, you reduce line voltage with an impedance divider. By adding series capacitance, you can reduce voltage without dissipating power — this technique is used in capacitive dropper circuits for cheap, low power, non-isolated supplies. I chose to use direct coupling to avoid having a bulky and costly transformer. You can buy 120V to 12V AC 'wall wart' power supplies, but they are expensive compared to board mounted AC to DC supplies and I would have had to add a rectifier, a healthy amount of electrolytic capacitors, and a buck converter to power the rest of the circuit.
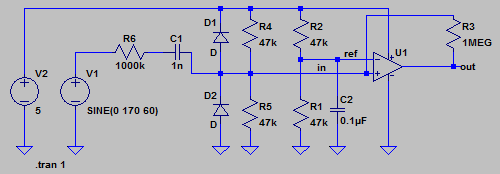
AC Line Zero Crossing Detector Circuit
The 1M resistor limits inrush current on hot plug events, and the 1nF capacitor drops the voltage from 170V peak to ~4V peak. Since this is AC coupled, I bias it up to mid-rail to keep the waveform in the common mode range of the comparator. R3 provides some hysteresis to prevent the output from oscillating if there is noise on the line. This hysteresis (and offsets in the reference voltage) add (mostly constant) phase offset but have no affect on frequency measurement.
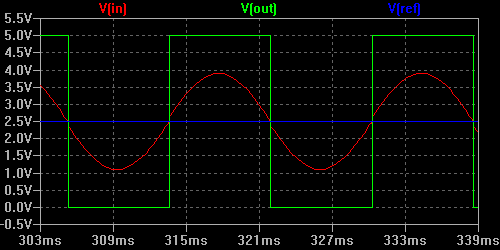
Detector Circuit Simulation
The downside of direct coupling for this application, in retrospect, is that the series capacitor introduces a ~90° phase lead to the measurement. This has no impact on frequency measurement, but it would need to be compensated for in phase measurement.
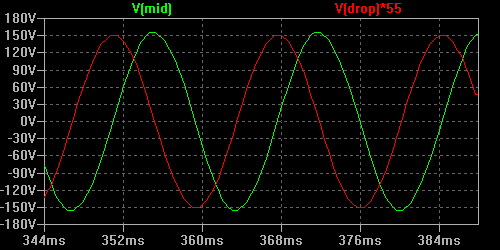
Comparison of Voltage Before and After Dropper Capacitor (Scaled)
The square wave output of this circuit is passed to an STM32F103 microcontroller. When a rising edge is detected, the value of a free-running timer is saved and the value saved on the previous rising edge is subtracted from it. The difference is the period of the AC line. The actual process is slightly more complicated since the timer actually overflows multiple times between rising edges, but these overflows are counted and added to the final measurement. Accumulated time error is measured by incrementing a variable on each rising edge of the AC line and decrementing it by 60 on each rising edge of the GPS 1PPS signal. This is not used for anything related to displaying the frequency, but it is sent out the serial port for data logging.
Construction
This project uses two PCBs: An outer PCB that mounts to the box and acts as a front panel and an inner PCB that has all the active circuitry. The inner PCB mounts to the outer PCB, so the assembly can be removed from the box as one piece. The stepper motor is mounted to the inner PCB, and its shaft passes through a hole in the outer PCB.
Inner PCB
This board has four parts: The AC power supply, AC zero-crossing detector, GPS receiver, stepper driver, and microcontroller. I detailed the zero-crossing detector int he frequency measurement section and will discuss the others here.
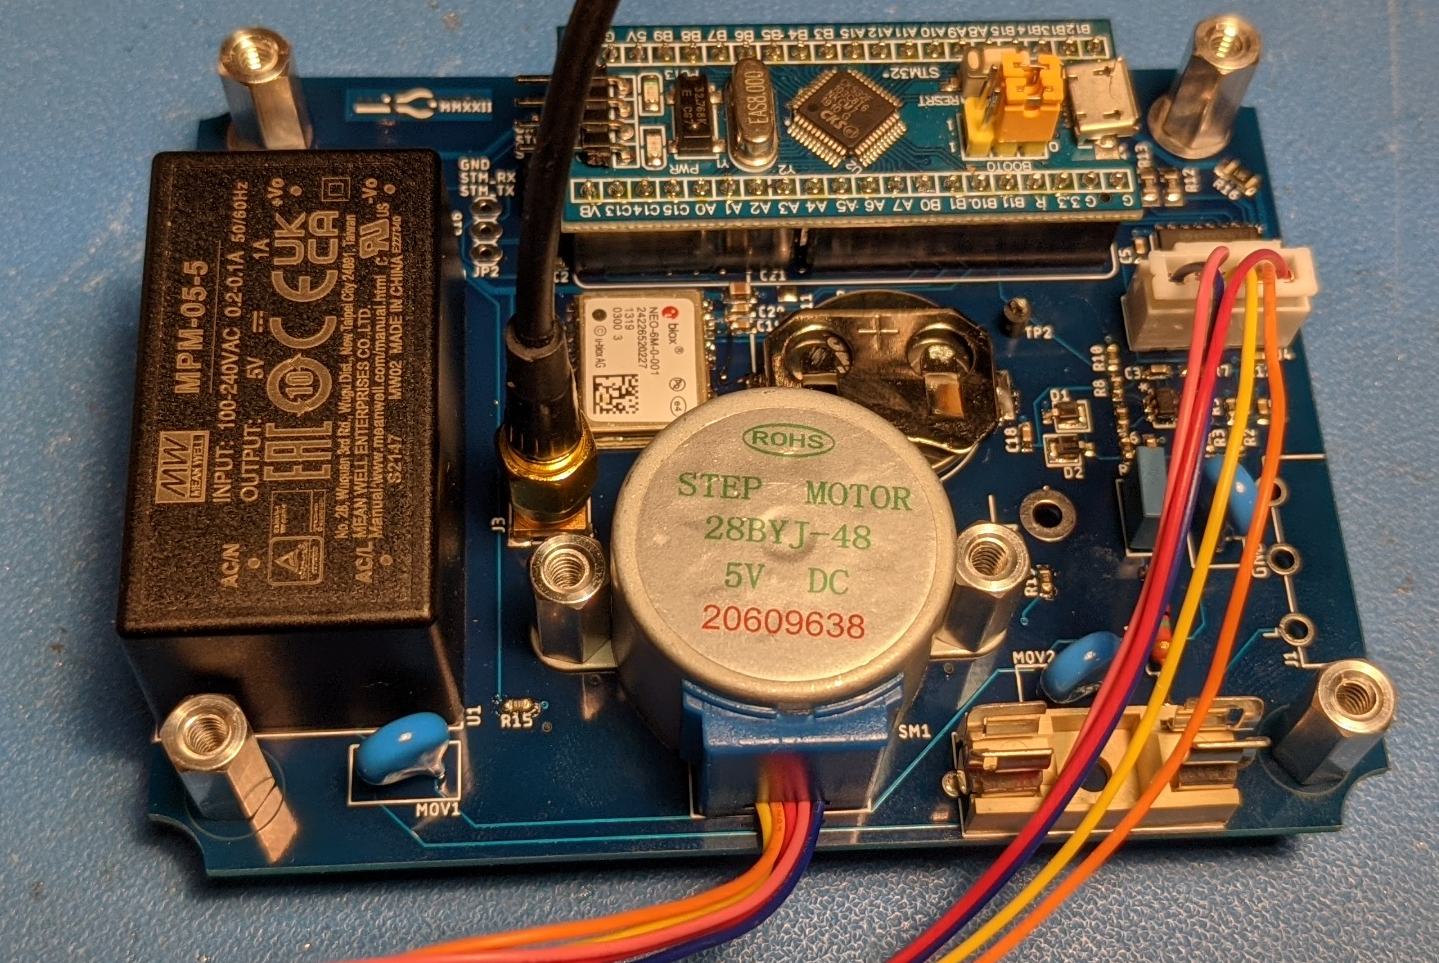
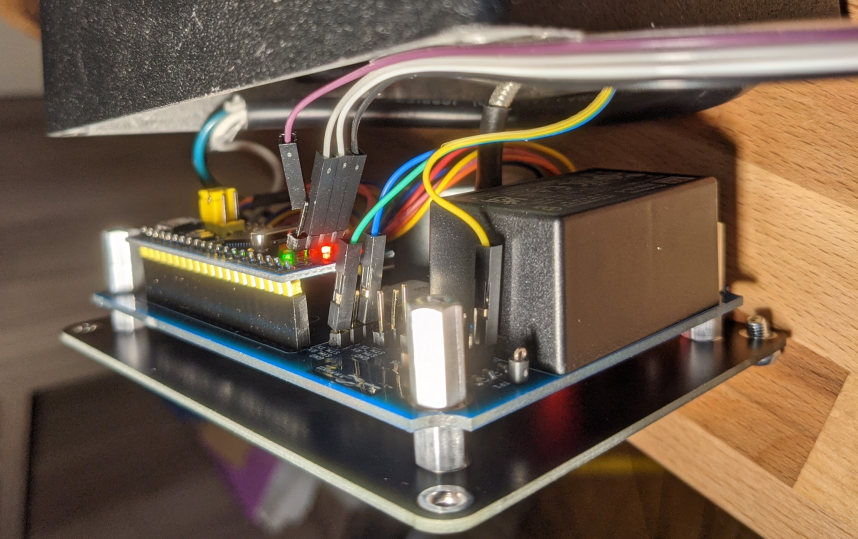
Assembled Inner Board
AC Power Supply
I used an enclosed board mount AC to DC supply to power the board. I ordinarily stick to DC and often USB power inputs for my projects for simplicity, but this project already needed mains voltage in the box (and I didn't feel like designing a 12VAC to 5V DC supply to run off a wall wart). I've designed boards with mains voltage for my day job and have been involved in their certification, so I feel comfortable building something like this, but you do need to be careful when working with mains. Its generally not worth the trouble to design your own AC to DC supply. Making a cheap AC power supply that can pass EMC testing is hard, and contract manufacturers like Delta and Meanwell will sell you a supply that gets the gets the job done at a reasonable price. This isn't an appeal to laziness; this is an appeal to economics. It will cost more to develop an in-house AC power supply than you will save compared to buying one from a power supply vendor unless you're building 100-1000k units. Even then, its a risk trade. Take a look at your laptop charger: unless you have a Mac Book, you're likely to find in small print that the charger was made by a different company than made the laptop.
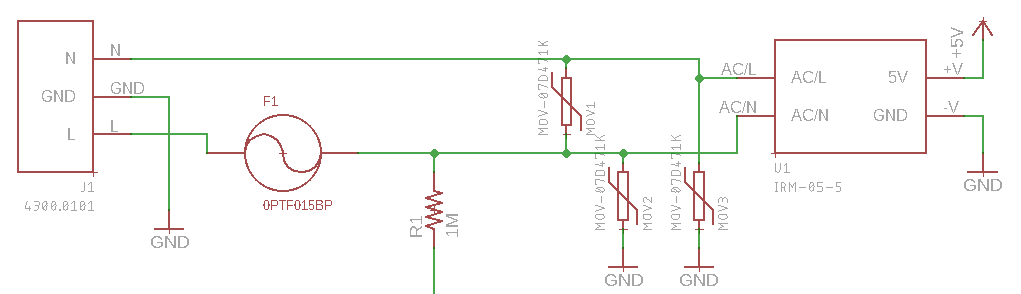
AC Power Circuit
I added a 100 mA input fuse to limit available power as well as MOVs to absorb line surges. In the event of a surge, the input fuse may blow, but it can easily be replaced. The AC power supply is rated for surges, and the steering diodes in the zero crossing detector should handle surges as well, so the added MOVs are maybe overkill, but BOM cost doesn't matter when you're building in low quantities.
GPS Receiver
GPS is a great source of super precise time. Most GPS units can output a 1 PPS signal which is a signal with an edge transition aligned with the start of every second. The accuracy of this signal is typically within a few tens of nanoseconds from that of the true time. I use this 1 PPS signal to compensate for frequency offset in the crystal used to clock the microcontroller. Since the microcontroller is counting clock cycles between zero-crossings of the AC line, if my crystal is off, my frequency measurement will be off. I used an eBay STM32F103 Blue Pill board, so I don't actually know the performance of the crystal. The cheapest 8MHz crystals on Digikey are 30 PPM, so that's probably a good guess. With a 30 PPM crystal, frequency could also be off by roughly 30 PPM. For 60Hz, that is 1.8 mHz which is significantly more than the minimum resolution of the stepper.
I compensate the frequency measurement by using a second timer to count number of clock cycles between PPS rising edges. From this, I calculate what the microcontroller measures the PPS frequency to be. If its clock is running 30 PPM slow, it will measure the PPS frequency to be 1.00003 Hz and if the clock is running 30 PPM fast, it will measure the PPS frequency to be 0.99997 Hz. I divide the microcontroller's measurement of the grid frequency by its measurement of the PPS frequency to get the true grid frequency.
The actual GPS receiver I use is a uBlox NEO-6M. This is one part I buy on eBay from China because its significantly cheaper than Digikey and this is just a hobby project. A bias-T injects 5V into the GPS antenna port so that I can use powered antennas. Powered antennas amply the signal prior to it passing through cable back to the receiver. Loss prior to the LNA hurts your signal to noise ratio, but loss after a typical LNA (up to a point) has basically no impact on SNR. This lets you get away with a a long and lossy cable.
The coin cell on the inner board keeps SRAM on the GPS biased so that it can establish a fix more quickly after power is lost. The PCB actually connects the GPS backup rail directly to 3.3V, so I had to cut a trace and solder in a jumper to connect it to the backup battery. I also had to add a jumper wire to connect the PPS line to a pin on the microcontroller that would support it as a timer input; the datasheet listed timer2 channel2 as alternative function of the pin that I chose originally for PPS, but in this part apparently if you put any TIM2 channel on the alternate set, they all have to be put on the alternate set. So I just jumpered this pin over to a pin that supported TIM2 CH2 as a default function.
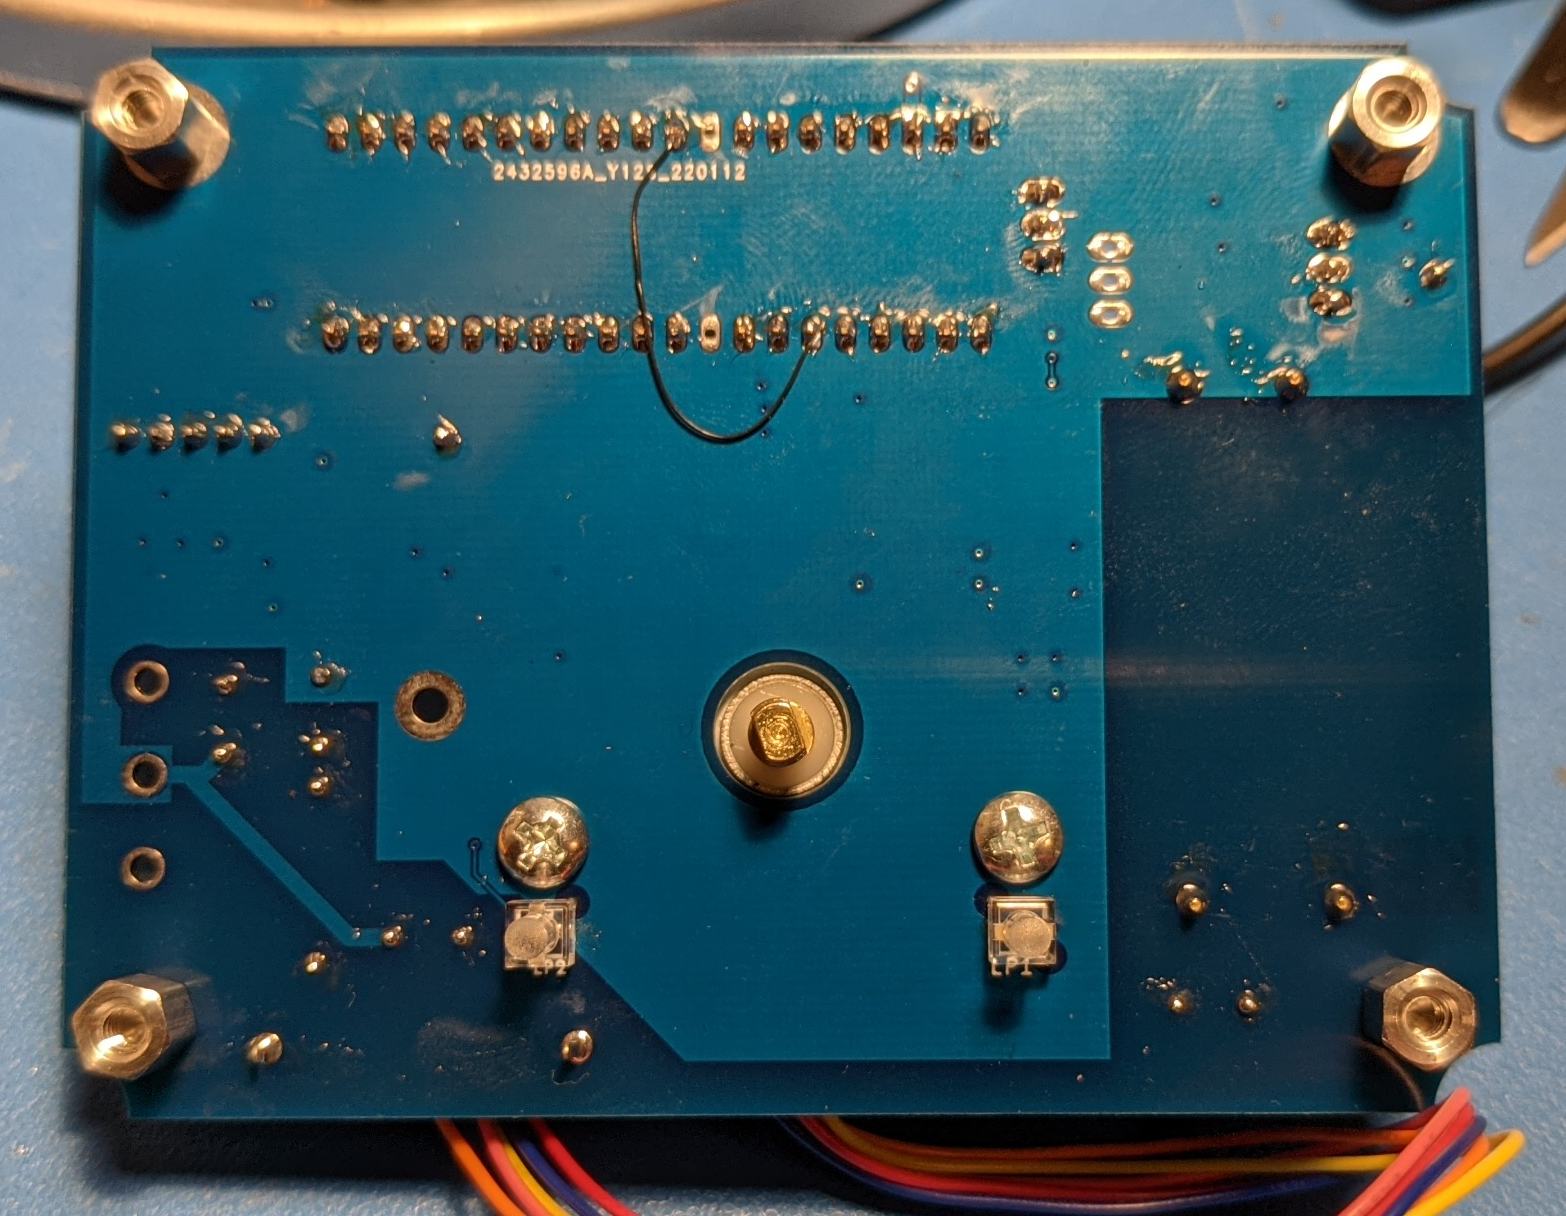
Other Side of Inner Board
Stepper Driver
The cheapest stepper motor on eBay is 28BYJ48, so that's what I used for this project. It has some slop, it gets a bit warm, and you'll destroy it by backdriving it, but it works acceptably for this application. I designed the surface mount version of the Darlington pair NPN driver chip that it comes with onto the inner board and placed holes to mount the stepper to the board as well. Since I coded this project in the STM32Cube IDE, I couldn't use the Arduino driver, so a wrote a simple one from scratch.
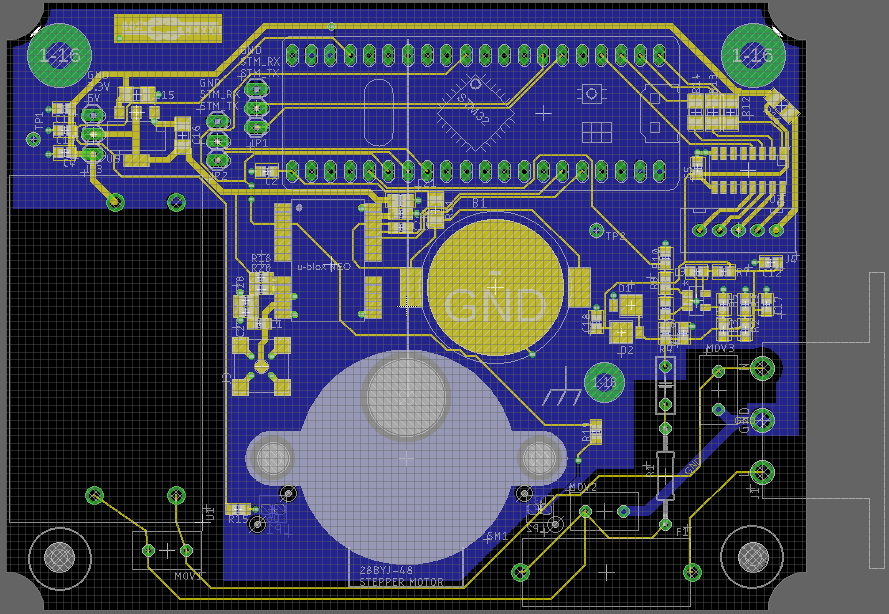
Layout of Inner PCB
Microcontroller
Since I had plenty of room and was able to use through hole parts, I used an STM32F103 Blue Pill board from eBay to run the show. I chose this part due to its capable timer peripherals, but after learning about the capabilities of the ESP32, I'd probably use that part if I were to design this again from scratch. When the microcontroller starts up, it zeros the display by running the stepper for a pre-determined number of steps counter clockwise. Since the indicator is almost always in the range of 59.95-60.05 Hz, I have it step back the number of steps equivalent to a 60.05 Hz measurement. This results in it hitting the hard stop for a bit, and then the stepper is brought clockwise for a predetermined number of steps found to correspond to 60.0Hz. I found this by trial and error, and it ended up being the same for the two units that I built.
After calibrating, the microcontroller starts adjusting the dial to match its measurement of frequency. Every 50ms it calculates the desired position of the dial and moves it by one step toward the desired position. If it is at the desired position, the dial does not move. Grid frequency changes slowly, but there are some events that won't register their full amplitude since this is limited to ~8 mHz/second.
Whenever the rising edge of PPS is detected, a variable is set to tell the main loop to send a message out the serial port with the average frequency measured over the previous 60 measurements. It also sends the cumulative time error which is the number of seconds difference between GPS time and that displayed by a clock driven by a synchronous motor connected to the AC line since the box was plugged in. There are several headers which provide access to microcontroller serial, power, and GPS serial so that an ESP32 development board could be added to turn this into an IoT frequency meter. I thought of this after finishing the board design for the inner board and didn't want to add scope creep, so I left these as headers.
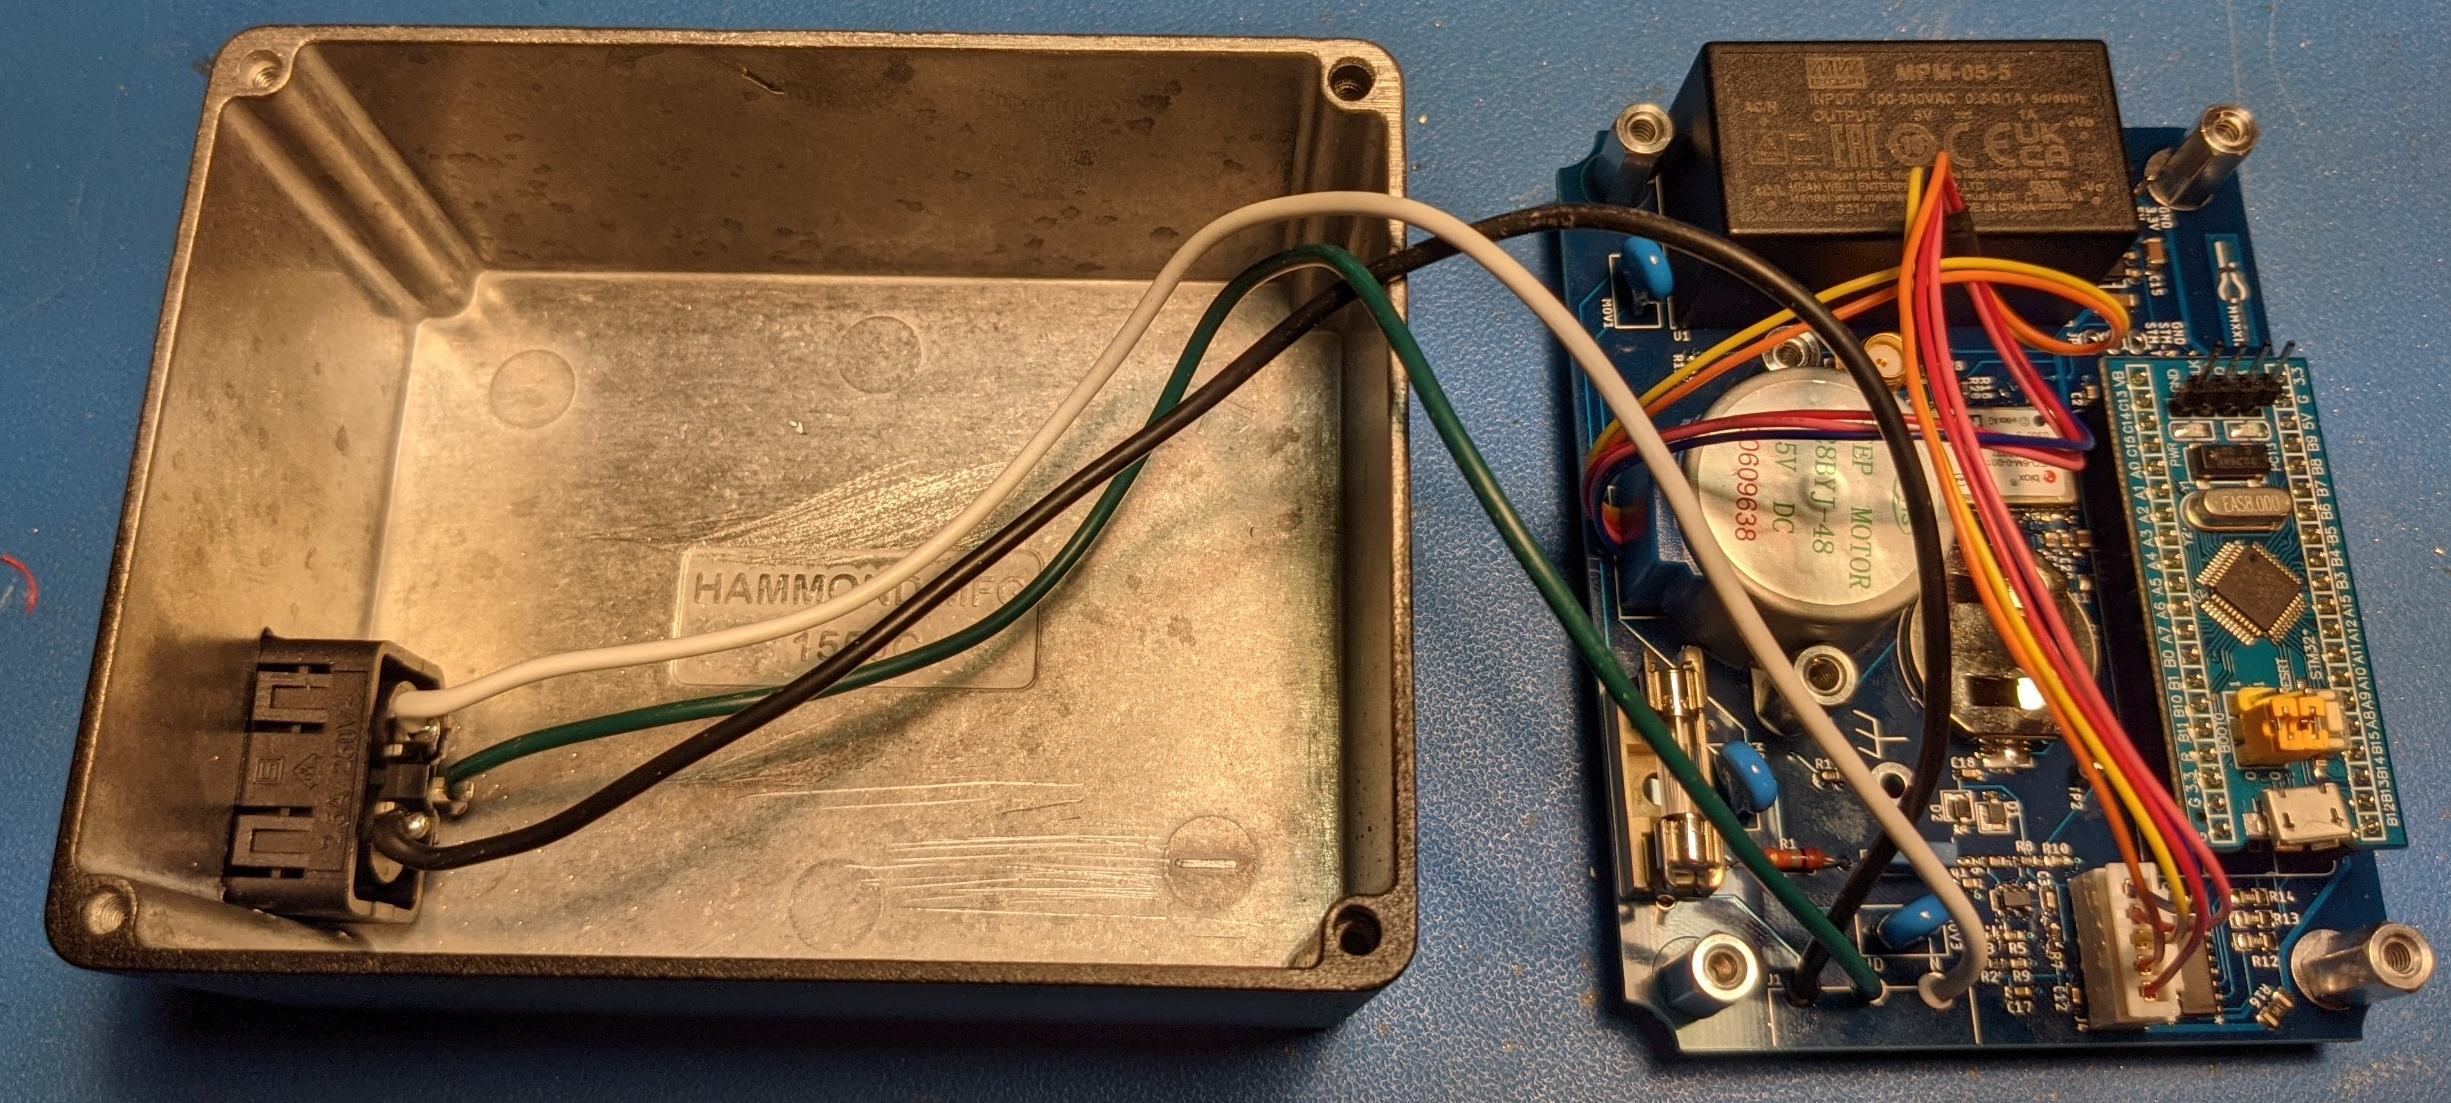
Outer and Inner Board Assembly
Outer Board
I really like using black PCBs as front panels for projects. For very little money, you can get a very dimensionally accurate and visually appealing front panel, and you spend zero time drilling holes and adding labels. I started doing this with my Picoammeter using a smaller Hammond box and applied the same design for my Geiger counter and random number generator. I used surface mount through hole standoffs as hard stops so that the dial can zero out when power is lost. Aside from that, no components are soldered to this board.
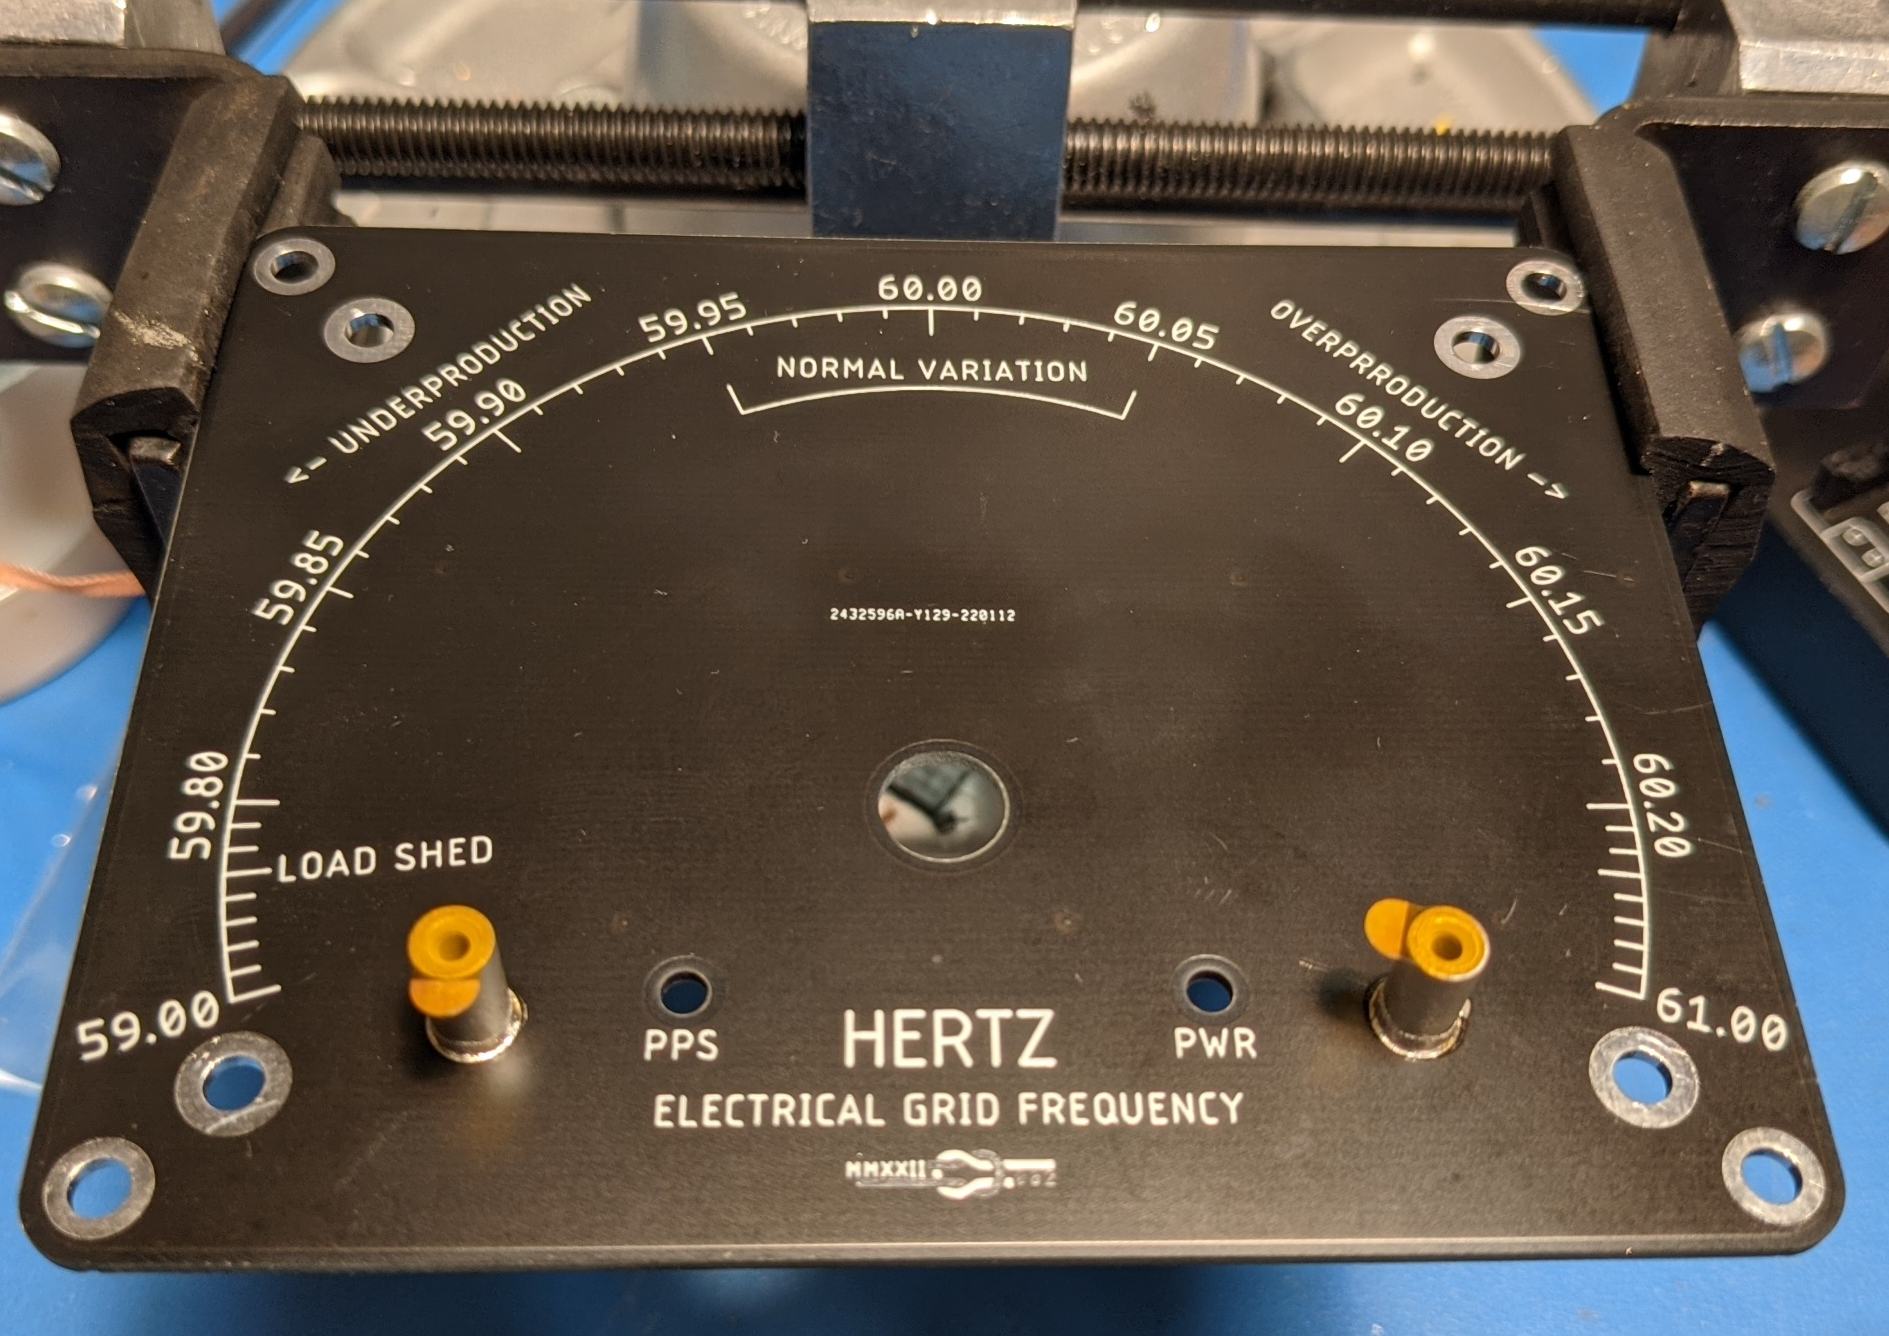
Front Panel While Soldering Hard Stops
I drew the tic marks in a CAD program and imported the resulting DXF to Eagle to turn that into a PCB. There are two holes for light pipes that bring light from a 1 PPS LED and a power LED on the inner board out to the front. I selected a standoff height ()between the outer and inner board) and light pipe part such that the face of the light pipes is flush with the face of the front panel. I think it came out nicely.
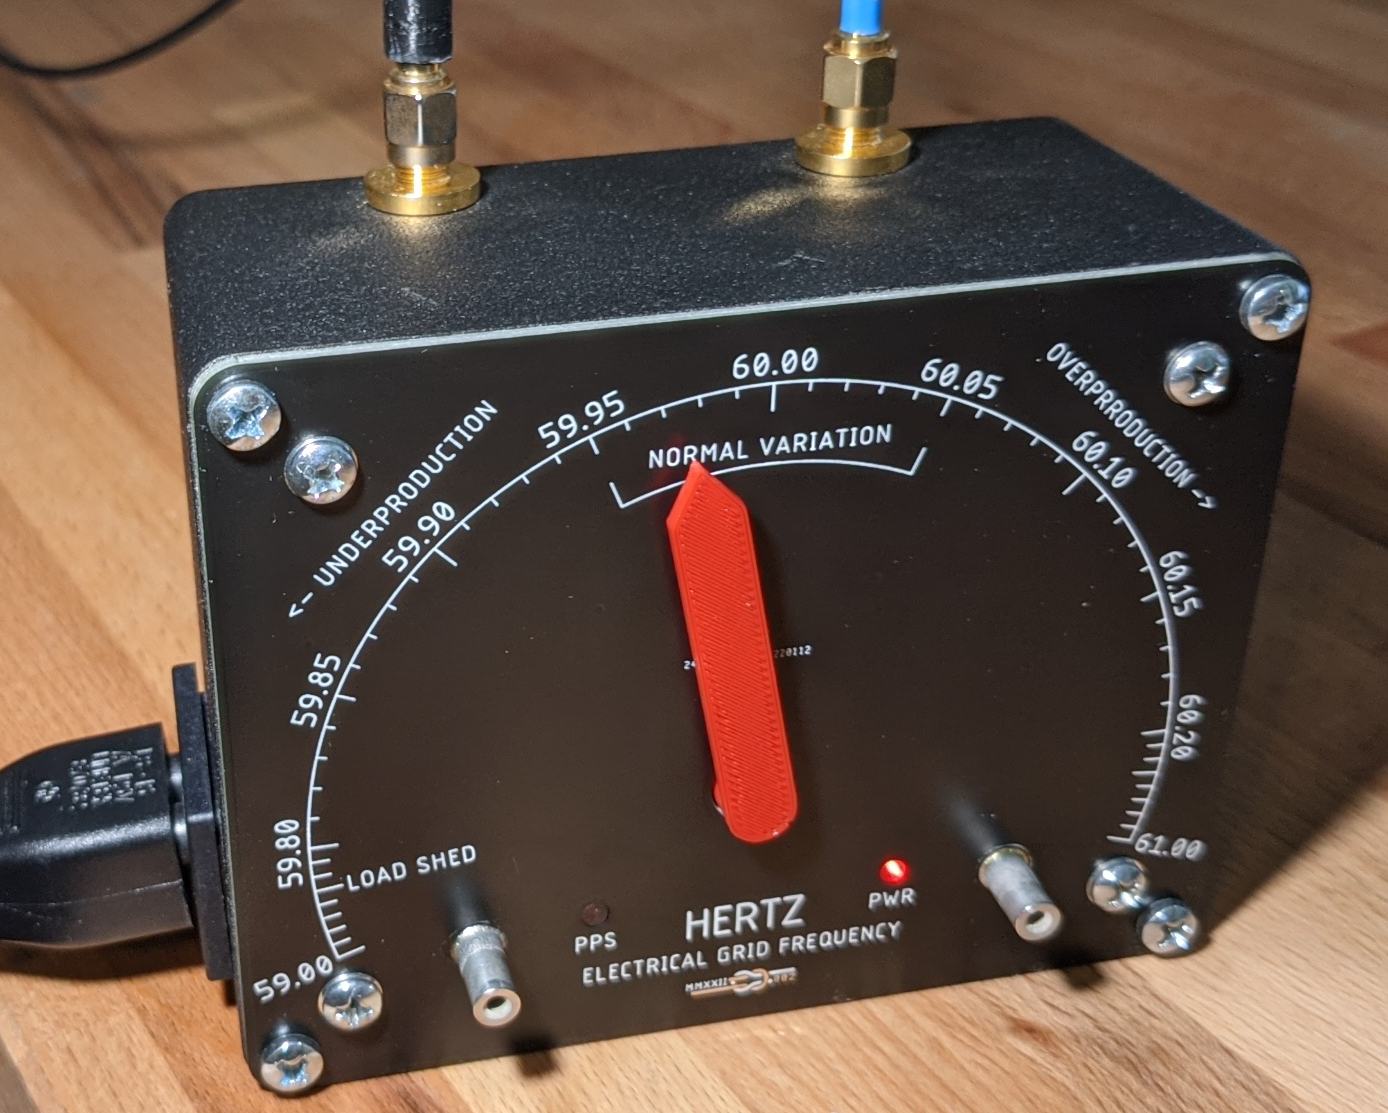
Front Panel Assembled
Box
Since there is live AC on the main circuit board and I am paranoid about electrical fires, I designed the meter around a Hammond 1550C aluminum project box. Nice enclosures are annoyingly expensive compared to electrical parts and PCBs, but I could not find anything better for this project. I would not be comfortable using a 3D printed enclosure for this because both ABS and PLA are quite flammable — I don't even like running my 3D printer when I am not at home.
Hammond Project Pox After Installing AC Input
Since there is live mains inside of this box, IEC/UL 62368-1 (which superceeds the old IEC 60950 and which is the standard a product like this would have to meet to be sold in the US) requires that the box be a fire enclosure. Fire enclosures are a complicated topic with many caveats, but in general if you have an unbroken enclosure made of fire rated plastic or metal, you are in the clear. You can use a PCB as part of your fire enclosure as long as it doesn't itself have traces on it that can source more than a certain amount of power. The PCB inside the box cannot be used as part of the fire enclosure because it has has mains on it, but the front panel PCB is fine because it has not active circuity. As long as I added a dedicated grounding screw to the aluminum box, I think I would be in the clear for UL 62368-1 certification on this guy, so I can sleep soundly knowing it is unlikely to set my house on fire.
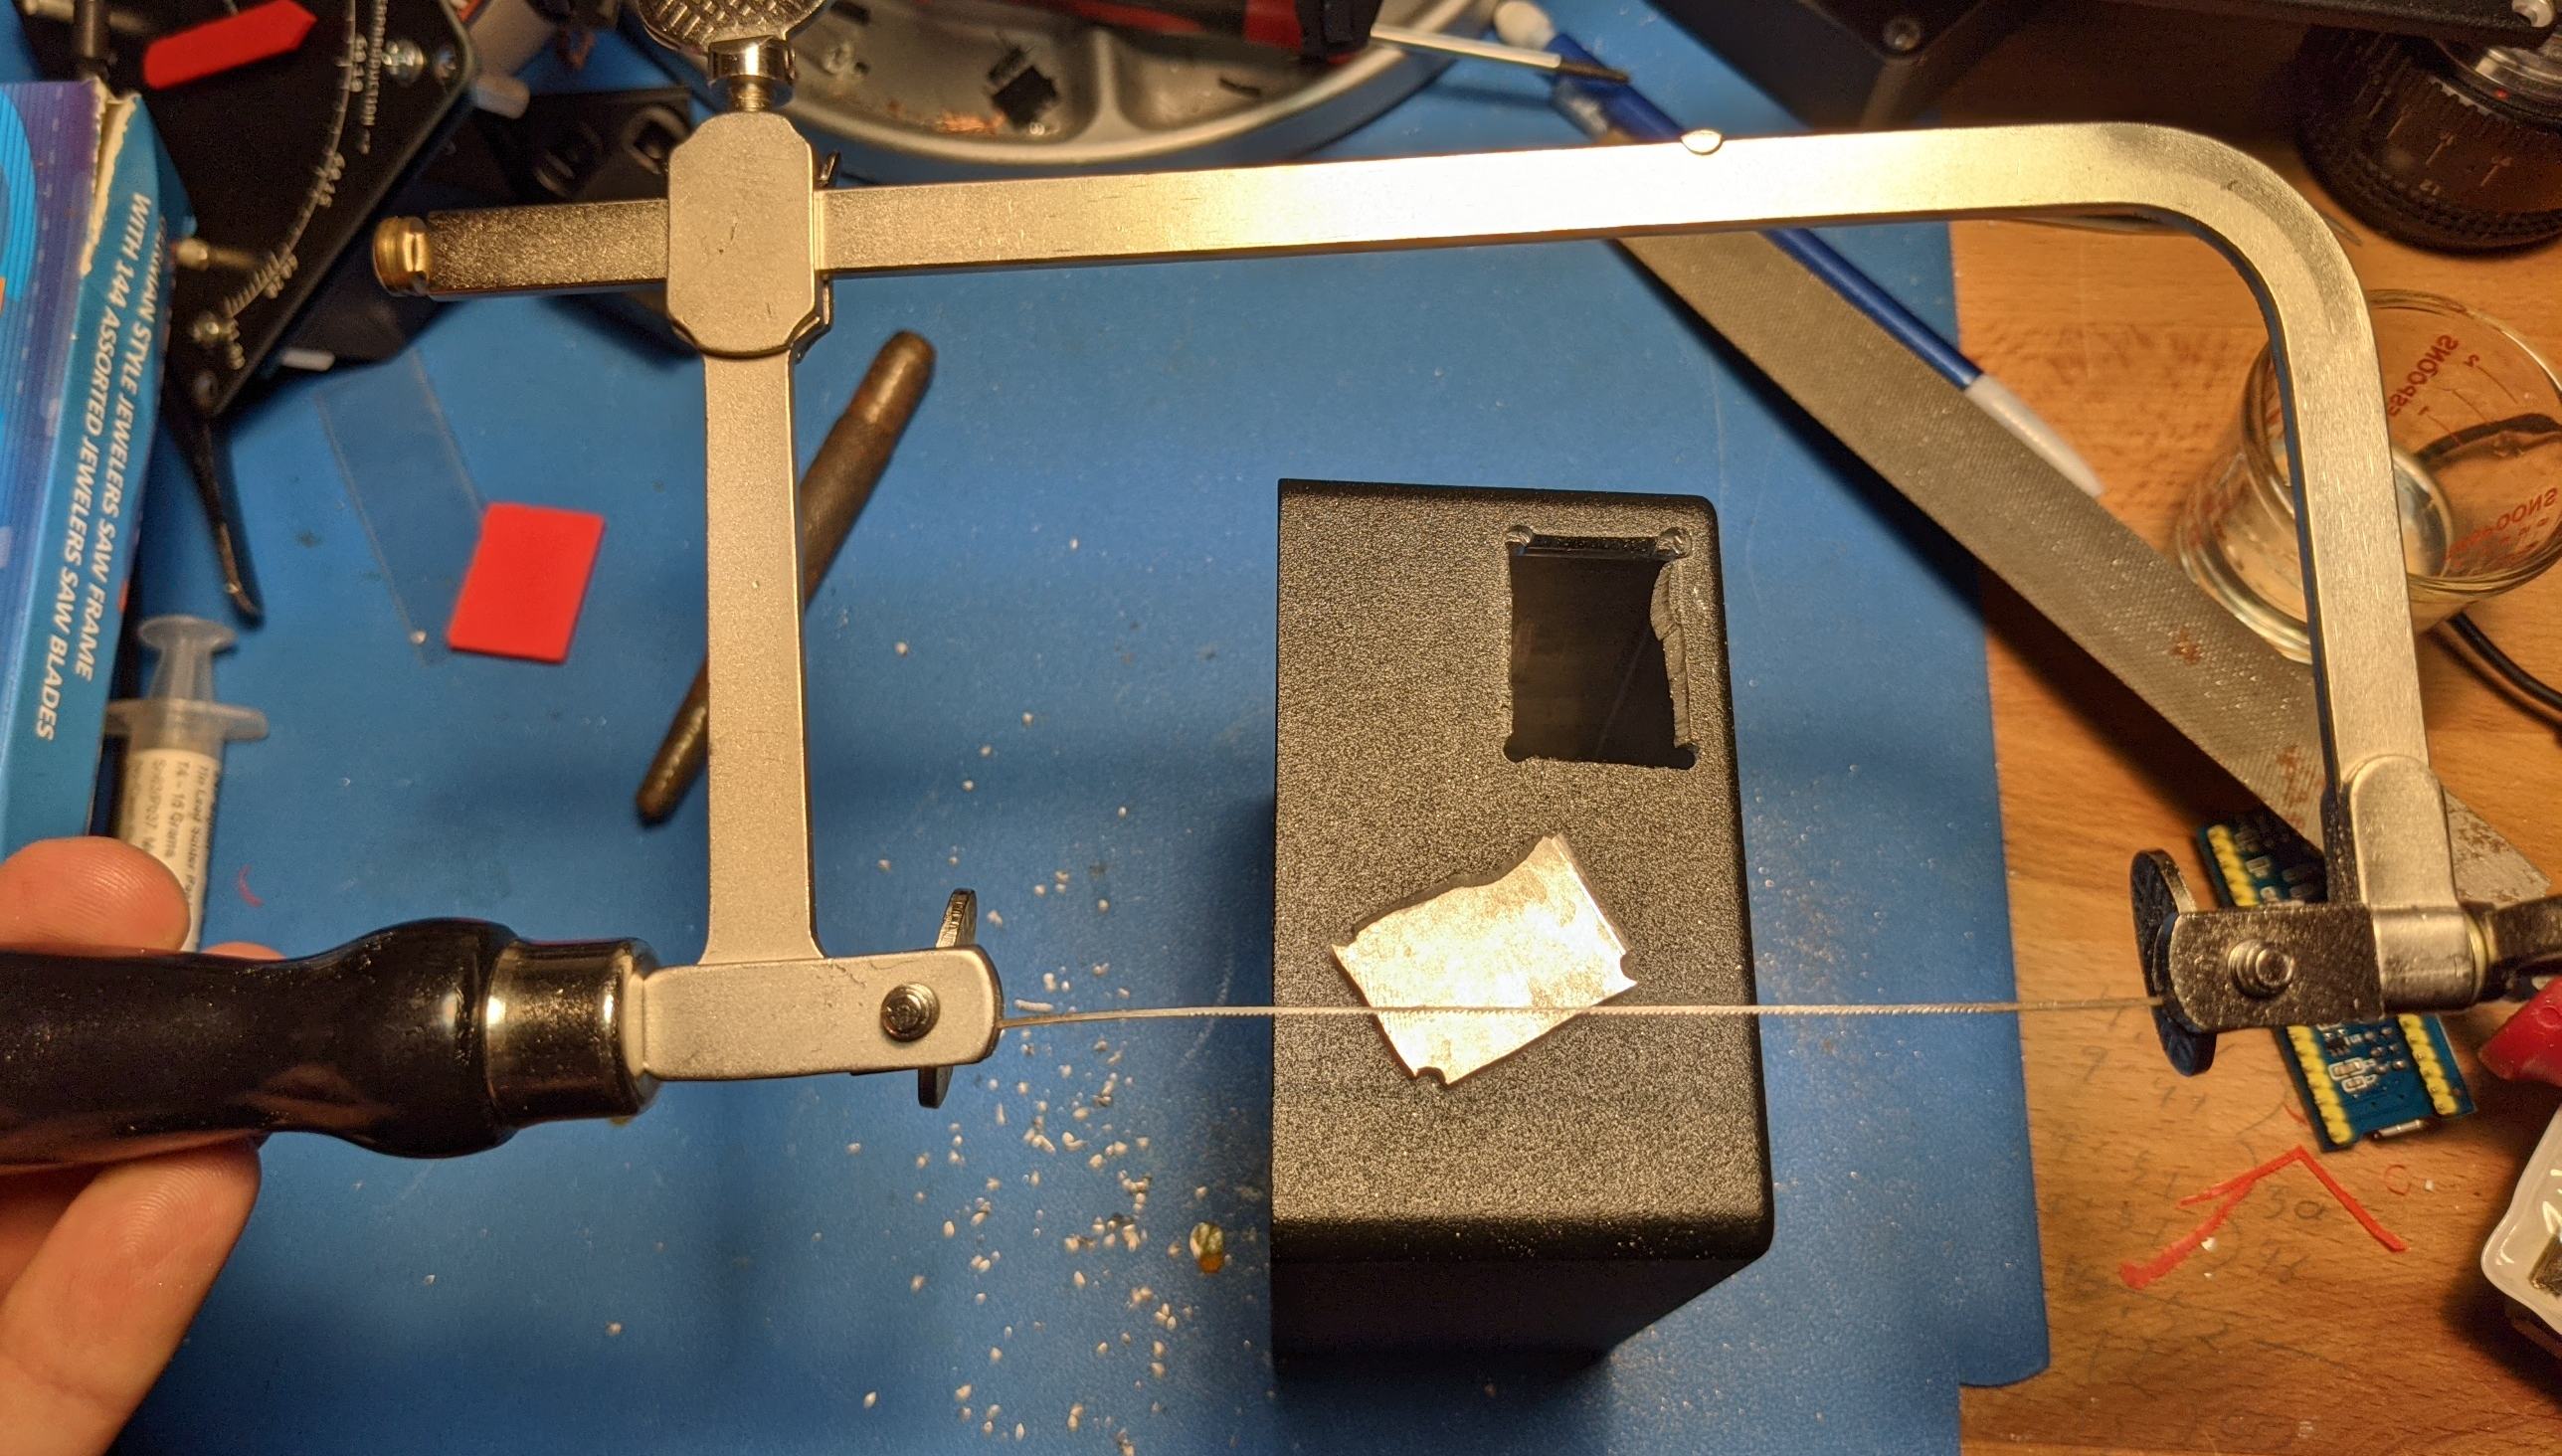
Hole For Power Input Before Filing
To get power into the box, I used a panel mount IEC 320-C6 receptacle (the same as is often used on televisions and laptop chargers). To make the square hole for this, I drilled out the four corners, cut in between them with a Jewelers saw, and filed to finish. To make marking the hole and visualizing where it would go easy, I 3D printed a rectangle the same size as the desired hole.
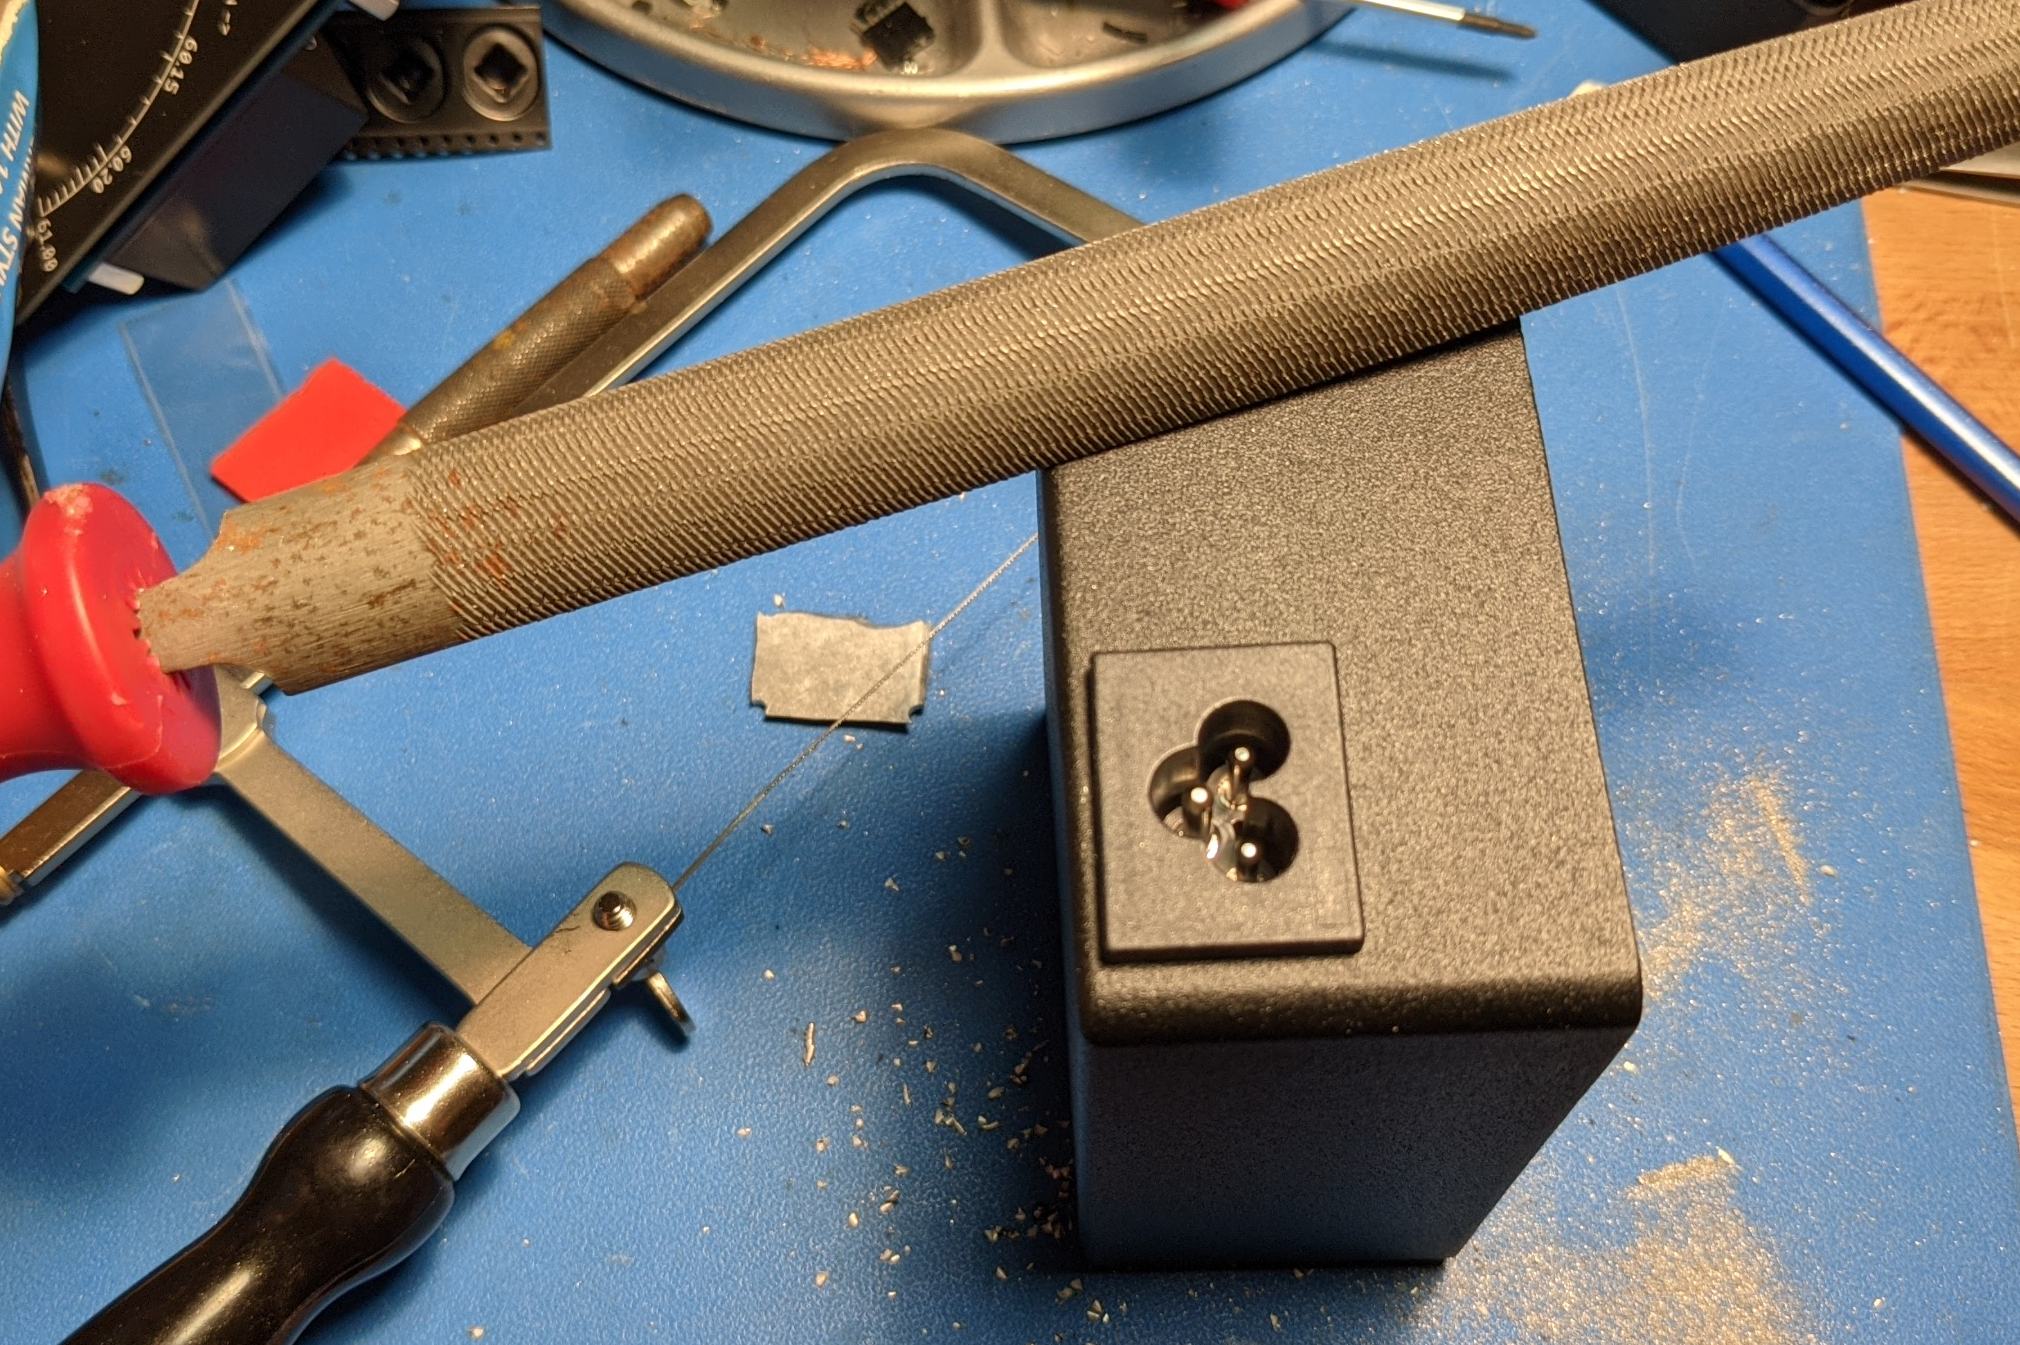
Installed IEC 320-C6 Receptacle
To pass GPS RF into the box, I used two SMA bulkhead connectors that I found in the trash. .
Result
I've left it on 24-7 for several weeks now without issue. There were a couple of early software bugs that I cleared up, but most of the software trouble was with the ESP32 and server side stuff. Here's nearly an hour of activity sped up by 30x:
Here are two screenshots of data that you can see live on this page.
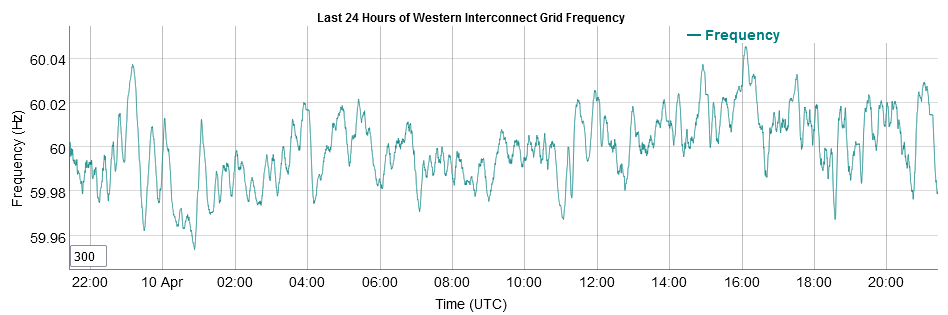
Western Interconnect Grid Frequency on April 10
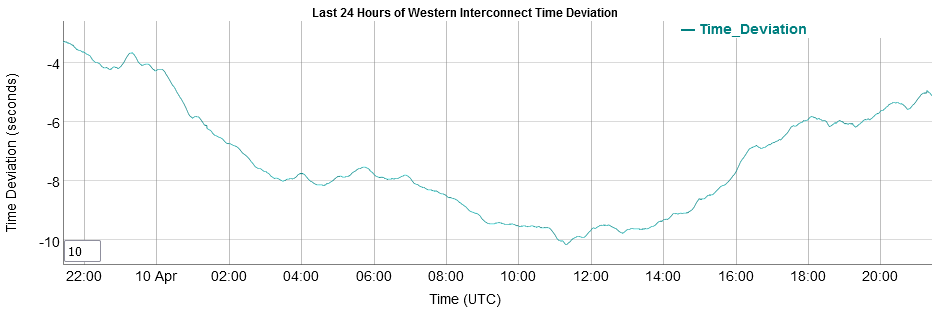
Western Interconnect Grid Time Deviation on April 10
Update 2022-8-28
It took a while to sort out all the esp32 bugs, but the meter has not been running continuously for more than two months. Here is a histogram of frequency deviation over the last four months or so:
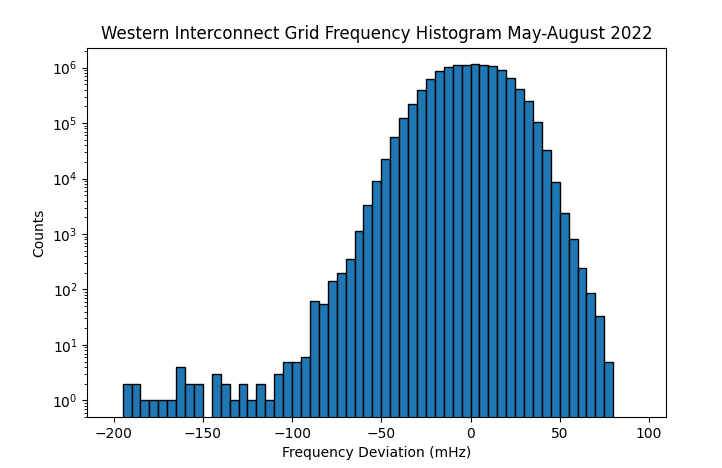
May-August 2022 Frequency Deviation Histogram
Note the long tail on negative deviation. This isn't a measurement error. There were two distinct transient events that contributed to this. One on 2022-04-04 and one on 2022-05-25.
The April deviation event includes the lowest frequency I have seen so far: 59.81 Hz. Since frequency is dφ/dt, this short duration transient may have (if I had to speculate) been due to loss of local generation causing the phase angle of locally observed power to lag with respect to grid average phase due to more supply coming from further away through higher line inductance. Frequency returned to within 100mHz of nominal within 20 seconds for both of these cases. In the 2021 near collapse of the Texas grid, it took 20 minutes for frequency to return to within 100mHz of nominal and the minimum frequency was 58.30 — a deviation of 1700mHz vs. a deviation of 190mHz.