Proton Range In Matter
2022
Charged particles behave a bit unintuitively as they pass through matter. The faster they are going, the less energy they lose per unit length. The plots on this page show the average remaining energy of protons after passing through various thicknesses of various materials. The practical application of these plots is to roughly estimate impact of stacking multiple test articles in the same beam and to estimate the thickness of various materials required to stop protons of various energies.
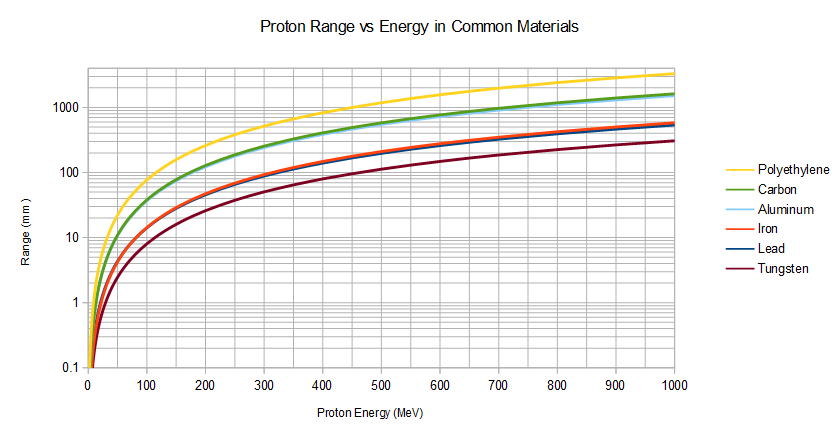
Range of Protons up to 1 GeV In Various Materials
As particles slow down, energy lost per unit length increases up to a certain maximum value unique to each particle. This point is called the Bragg Peak, and in nuclear medicine it is used to more efficiently target tumor cells.
SRIM / TRIM
I generated the loss plots by taking the range tables generated by SRIM and calculating the difference in range between protons of different energies. The x-axis is the depth into the target, and the y-axis is the remaining energy. For example: to produde to 450 MeV plot for aluminum, I set the "depth into target" to zero at 450 MeV and then calculated the difference in range between 400 and 450 MeV protons (79 mm) and used that as the second point on the x-axis corresponding to the depth at which 450 MeV protons are attenuated to 400 MeV. This process continues until the 1MeV point which is effectively the same as the range of a 450 MeV proton since the range of a 1 MeV proton is only 10 µ in aluminum.
SRIM and TRIM are very old programs, but they get the job done. I still use an install on an old Windows 7 Thinkpad T410, but here is a guide to running SRIM in Wine on Linux.
Plots
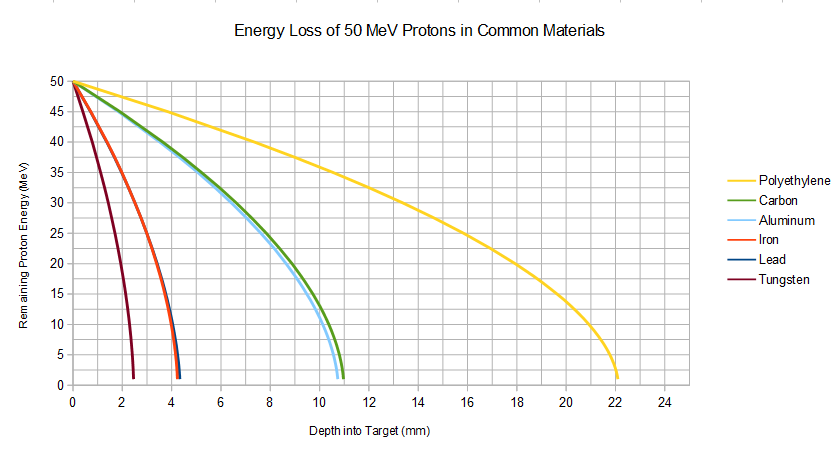
Average Remaining Energy of 50 MeV Protons vs. Depth into Target
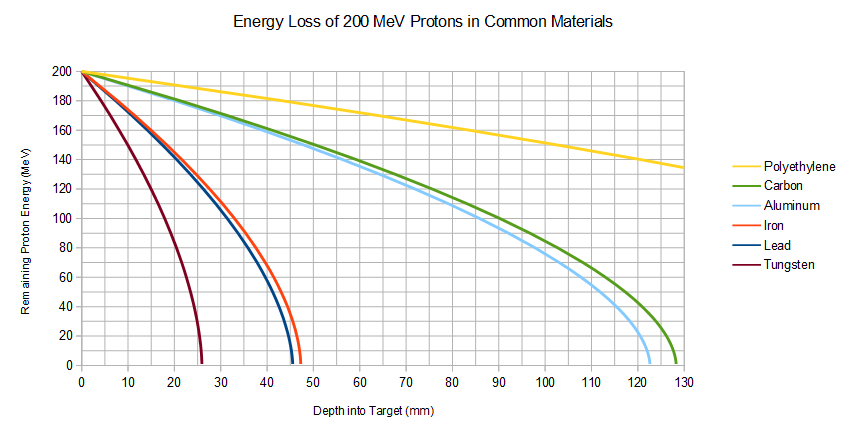
Average Remaining Energy of 200 MeV Protons vs. Depth into Target
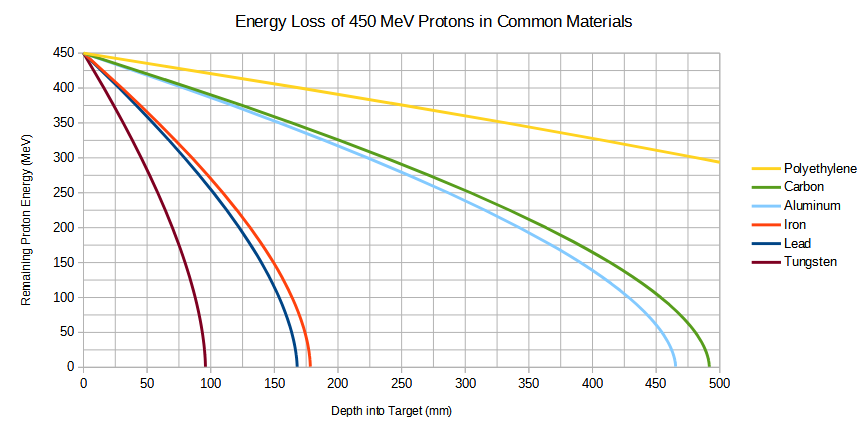
Average Remaining Energy of 450 MeV Protons vs. Depth into Target
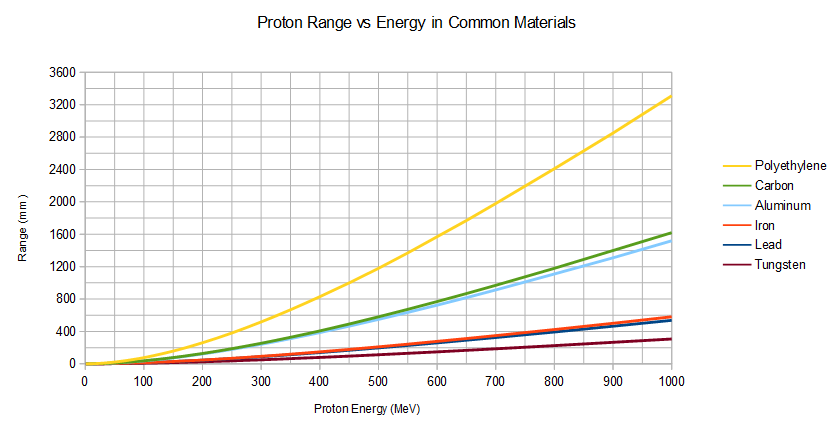
Range of Protons up to 1 GeV In Various Materials
Density Doesn't Directly Correlate to Stopping Power
One surprise I had (as someone with no formal nuclear engineering training) when reviwing the results of these simulations was that there was not a diect correlation between stopping power and material density. Iron has a density 144% that of lead, but iron and lead have rather similar stopping powers. A Nuclear Engineer PhD friend of mine pointed me to the obvious (in retrospect) reason: charged particles such as protons (which are just ionized hydrogen atoms) interact most with other charged particles (namely electrons) and not neutrons. The stopping power of a material can be calculated using the Bethe equation which is proportional to electron density.
Lead has 4.5 mol electrons per cubic centimerer and iron has 3.65 mol electrons per cubic centimeter. lead's density is 11.4 g/cm^3 and iron's density is 7.9 g/cm^3. While lead is 44% more dense than iron, its electron density is only 23% higher.
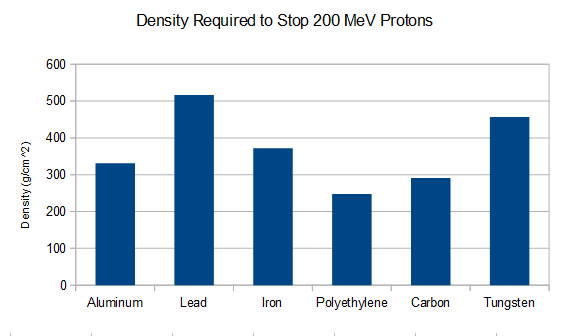
Densities of various materials required to stop 200 MeV Protons
As a result of determining that the shielding effectiveness of iron and lead is similar, I've started to use iron shielding blocks in 200 MeV radiation testing instead of lead shielding blocking because iron produces fewer spallation neutrons and gets far less activated in the beam. Far more gammas get through and iron shield (empirically per my testing with a DSLR camera), but this isn't a significant factor for most single event testing.